Every source becomes a table
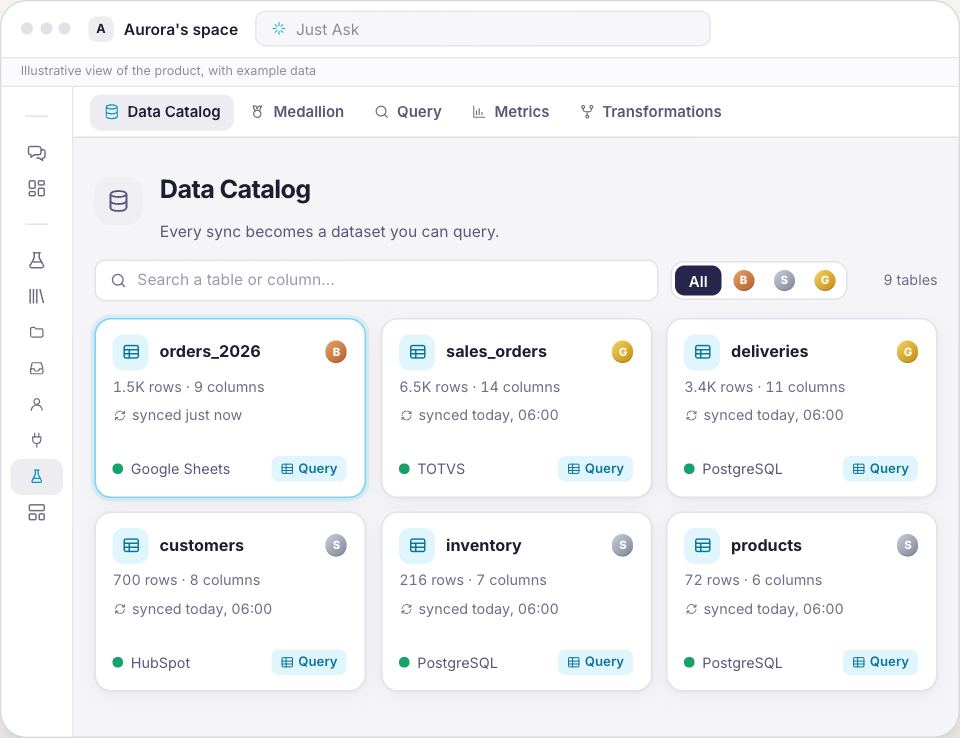
Databases, spreadsheets and systems become queryable tables — ready for queries, metrics and agents.
A PDF and a spreadsheet do not answer the same way, which is why they take different roads in here: text becomes a passage with the page in view, and a table becomes a column you can sum, filter and join. You connect the source, the catalog builds itself, and a question in plain language turns into a real query with the SQL on screen.
The catalog with each table's origin, the question the AI turns into a query, the result you check, and the certified metric everyone uses.

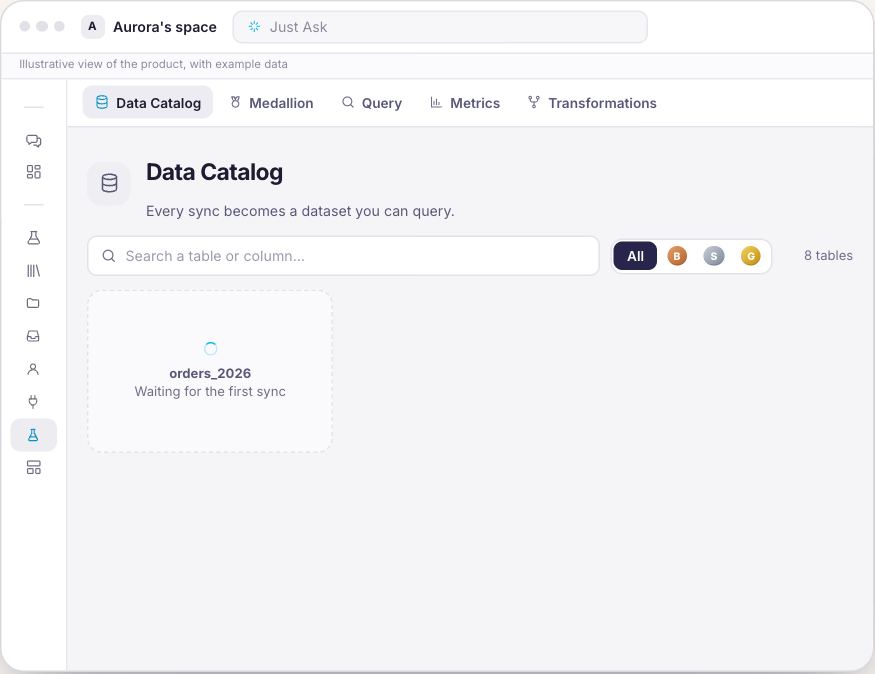
Drag the line and see the difference between rebuilding the spreadsheet and simply asking.

A digital nervous system: you connect what your company already uses — through a ready-made connector, when one exists, and through the API, when one does not. In both directions: Synapse queries your company’s system, and your company’s system calls Synapse with a signed call.
When Bluey answers with a number from your company, it did not come from a similarity search or from a file someone attached a minute ago. It came from here.
The Data module connects the company’s sources, lets anyone ask in plain language and returns the number with the page that proves it — certified metrics, permissions and the SQL in plain sight.
Databases, spreadsheets and systems become queryable tables — ready for queries, metrics and agents.
Your way, the SQL comes ready: Synapse writes the query and the number comes from the table, not from a guess.
The answer comes with the page that proves it: "R$ 480 per night" — and where it came from, in one click.
One number, one definition — a certified metric, with the synonyms the team uses.
Save the result as a table: Personal, only you see it; Corporate, the team uses it.
Every source and table with the permission it already has: the search returns only what your account can reach.
Each part of the layer hands over to the next: the source you connect today becomes a table in the catalog, then a question in plain language, then a certified metric.
The connection is always one of two things: a ready-made connector or your own API. You pick the account, pick what to sync and how often, and every sync materializes a dataset that agents and the console can query.
A text document goes in to be read and comes back as a passage with its page. A spreadsheet goes in to be queried and comes back as a column you can add up. Two different mechanisms because they are two different questions, and mixing them is what turns a number into a guess.
You write the question the way you would write it to an analyst, Bluey generates the SQL and the database runs it. The result comes back as a table and a chart, and the query that ran stays on screen so you can check the column and the filter before you use the number.
Gross revenue and billing are usually the same thing said two ways, and that is exactly where two screens start to disagree. A certified metric stores the definition once, together with the words the team actually uses, and everyone starts getting the same number.
Not every analysis belongs to the company. What you upload and the tables you save as personal in the Data Lab live in a space only you can see, and when the analysis matures you publish it to a schema your team shares.
The Data Lake does not start empty and does not start with a project. You connect what the company already has, and each connection becomes a queryable table on the other side.
Either way, the synced table is read and never changed at the source.
A ready-made connector or your own API, with the sync already scheduled at whatever frequency fits.
Every table arrives with its columns, the rows it holds and the trust layer it lives in.
Bluey writes the SQL, the table returns the number and the query stays on screen for you to check.
Bring the spreadsheet that gives you the most trouble or the system nobody ever queries, and we will look together at what they become in here.
What starts to exist in your space
It does not start with a configuration screen: the first conversation is about your source, not about ours.
On TVBluey, the company behind Synapse, on TECH SC by Globo NSC
No, and that is a rule rather than a preference. A tabular file goes down the columnar track, where a column stays a column and can be summed, filtered and joined. Vectorizing a spreadsheet row would destroy exactly that, so the product does not do it.
From the table. You ask in plain language, Bluey writes the SQL, the database calculates and the screen shows the query that ran so you can check the column it summed and the filter it applied.
No. Adoption starts from the systems your company already runs, the connector available for each one and the sync frequency that makes sense for that source.
It comes in through the API. The connection is always one of the two, a ready-made connector or your own API, with credentials encrypted and the source read-only.
It depends where you save them. A personal table is visible only to you, not even to the workspace administrator, and a corporate one is published to a schema your team shares.
You can. Transformations filter, compute fields, categorize, join datasets and aggregate step by step, and each one materializes the derived table in the catalog, ready to feed metrics, notebooks and agents.
We start from a question your company asks every week and follow it all the way through: where the data comes from, which track it takes and how the number arrives with the query in view.
The proposal considers the scope of the platform, the AI usage and the support for adoption, with the requirements assessed before anything is signed.

Point at the first source, let the catalog build itself and ask the question that costs you a whole afternoon of spreadsheet work today.
Talk to us about your data